POIntbrowse Help
Topics
Overview
POInTbrowse illustrates data from our polyploidy inference tool POInT. These data correspond to duplicated regions produced by polyploidy events. POInT phases these regions in multiple genomes into orthologous sets using synteny. Users can then visualize genomic regions and download coding regions and gene trees either for selected loci or in a batch format for larger analyses. Each column of homologous genes produced by polyploidy is referred to as a pillar.
Each event is searchable by gene name, but only includes genes that match to genes in the outgroup genome, which tend to include about 80% of a given genome. Hence, the browser is most effectly used by either starting from a random pillar or by finding genes in our data directories (see the "Data" button on the bottom of the browser page) and browsing from those names. If a gene that is not in the final synteny dataset is used as the query, its location will be shown with a small arrow indicating its position relative to the genes in the dataset.
In general, searches are conducted with gene systematic names. However, common names from A. thaliana, bakers yeast and zebrafish are also supported.
Quick-Start Guide
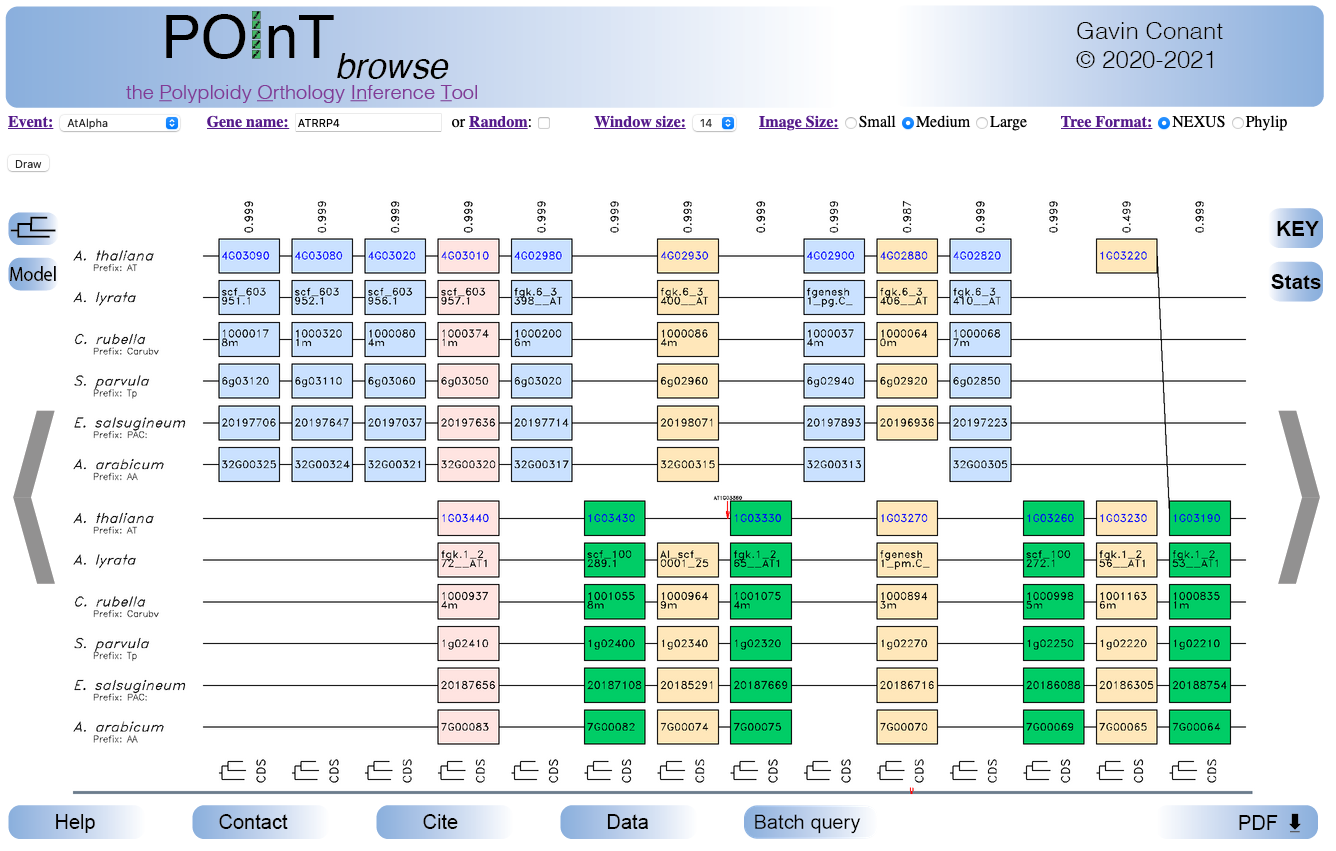
Opening a new POInTbrowse session will lead you to a page requesting the event for browsing. Once an event is selected, you will be able to search by gene name, select window sizes and the other features illustrated below.
Example POInTbrowse window
(Click for help on specific features)
Gene information
Hovering over a gene in the browser window will give its full name, chromsome/contig ID, starting and ending coordinates and any common names or aliases for that gene. If the gene name is shown in blue, clicking it will link to the model organism database in a new tab.
Searching for focal genes
All genomes can be searched by the gene ID set defined in that genome (for a table of genomes see here). For A. thaliana, S. cerevisiae and D. rerio, gene common names are also accepted. The selected gene will be shown with a pink outline if it is part of the synteny dataset or with a reference arrow if not.
Random Pillar
If you do not want to or do not have a focal gene to search for, selecting the "Random" checkbox will cause the browser to return a visualization of a randomly chosen pillar for that event. Note that selecting this box with cause POInTbrowse engine to ignore any gene names put in the gene name search field
Dataset version
In some cases, we have published different versions of POInT analyses of the same polyploidy. When one of these events is selected, the "Version" picklist will appear. In general, you should use the selected default version unless you are trying to replicate data from a particular publication, in which case that version can be selected. Different versions are currently supported for the TGD, where we recently found a new optimal POInT species tree.
Window size
The browser can return frames of between 10 and 25 pillars (columns): larger windows will make the included gene names illegible.
Polyploidy Event
Browsing of 13 polyploidy events is currently supported. For 6 of these events, multiple versions of these events are provided. In general, you should use the version with the largest number of genomes included, as listed below. The other versions are older and maintained on the browser to support the particular publication that they were used for.
| Event | Number of genomes |
| Apple/Pear WGD | 5 |
| AtAlpha | 10 |
| BrassicaWGT | 4 |
| CarpWGD | 2 |
| GrassRho | 8 |
| LegumeWGD | 8 |
| NematodeTripl | 3 |
| ParameciumWGD | 10 |
| SalmonWGD | 9 |
| SolacaceaeWGT | 4 |
| TGD | 11 |
| YeastWGD | 11 |
Genome lists, references and accession numbers are avalaible here.
Note that the yeast order and synteny data are taken from the Yeast Gene Order Browser Project (YGOB): the data presented here are a subset of the YGOB data filtered for the POInT analysis.
Version
Older versions of 6 datasets are provided to support the publications in question.
| Event | Number of genomes | Publication |
| AtAlpha | 6 | Emery et al., PloS Genetics 2018 |
| GrassRho | 5 | Emery et al., PloS Genetics 2018 |
| LegumeWGD | 4 | Hao et al., G3 2022 |
| ParameciumWGD | 3 | Hao et al., G3 2022 |
| SalmonWGD | 4 | Hao et al., G3 2022 and Coppage et al., Gen. Bio. Evol. 2025 |
| TGD | 8 | Conant PLoSONE 2020 |
| TGD | 8 | Naranjo et al., Mol. Phylo. Evol. 2024 |
Browser window size
POIntbrowse can generate browser frames in three different sizes, suitable for using the browser on differing types of displays (e.g., laptops verses larger monitors):
| Size | Pixel dimensions (x,y) |
| Small | 900x450 |
| Medium | 1200x600 |
| Large | 1800x900 |
POInT gene trees downloaded from a pillar can be output in either the NEXUS or Newick (Phylip) format.
Once you have selected a focal gene, window size and picture size, "Draw" will render the browser frame. The focal gene is shown with a pink outline, while all genes in the central pillar are outlined in darker pink.
Show the assumed POInT species tree
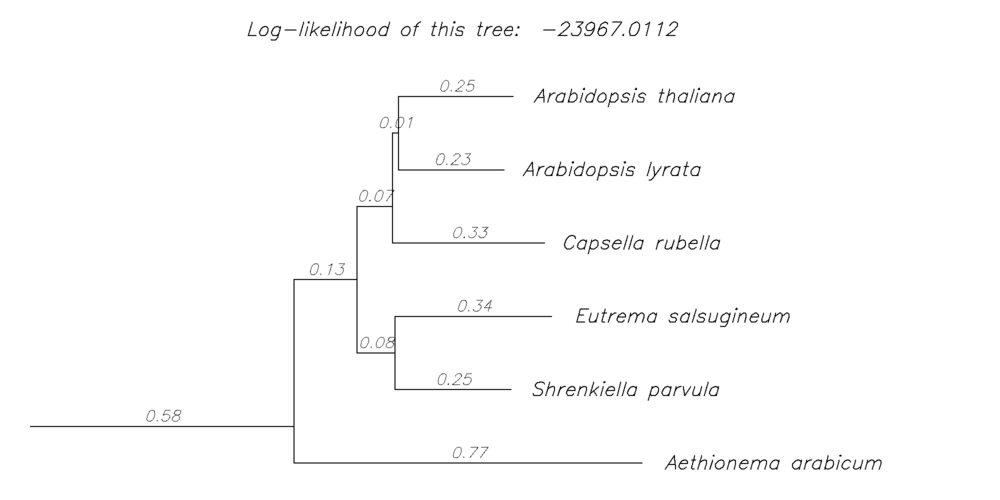 POInT's inferences are made on an assumed (or inferred) rooted species tree, where the (printed) branch lengths are proportional to the proportion of duplicate genes lost along a branch (relative to the starting number of duplicates). This pictogram will return a visualization of the assumed species tree for the event in question, including these inferred branch lengths (from POInT's ML optimization) and the overall log-likelihood of the pillar data for that tree and model. These images are generated dynamically from the daemonized POInT instances.
Show the duplicate loss model used
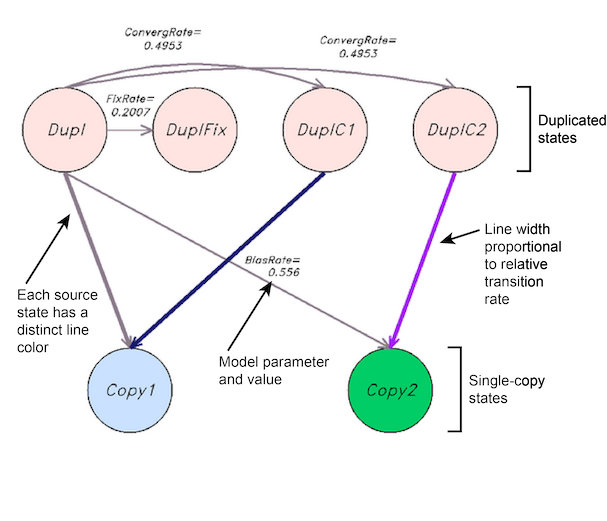 POInT uses user-specified models of duplicate (or more) locus evolution, where duplicates can be retained, fixed, or lost. This button displays a pictographic representation of the model used for the event in question, including the model states and the transitions between them. Arrow widths are proportion to transition rates, with dotted arrows representing very small transition rates. Each source state has a different color of arrow to emphasize that arrow widths cannot be compared between states because transition probabilities also depend on the transition rate to the source state and the phylogenetic branch length. The name and value of model parameters defining each transition are also given. These images are generated dynamically from the daemonized POInT instances.
Pillar-wise estimates of orthology confidence
Each pillar represents an inference of orthology and paralogy for the genes in it, with the genes in the first block being orthologs of each other, and likewise for the second (and potentially third) blocks. For a WGD, there are actually 2n possible such orthology relationships (where n is the number of genomes analyzed). The one shown is the one POInT estimates to have the highest posterior probability. Hence, if the confidence value given in 0.98, 98% of the likelihood of these data is accounted for by the orthology relationship shown, with the remaining 2% divided among the remaining 2n-1 relationships. Clearly, high values (>0.9) are desirable for downstream analyses. For the yeast and carp WGD events, no biased fractionation is modeled, meaning that the orthology inferences are degenerate (the top and bottom panel can be swapped). To account for this, the reported confidence combines the probability of the depicted pattern with one where all of the bottom tracsk are swapped with all of the top tracks, since these two patterns are not distinguishable with such models.
Navigate left or right
The arrows on left and right end of the browser window allow you to navigate 1/2 of the current frame size f (in pillars) to the left and right, respectively. When you reach the end of the pillar data, the arrows will simply show you the first or last f pillars for that event.
Genome names and gene name prefixes
For each of the blocks of orthologous genes shown, the species analyzed are given. In addition, if the gene names in that species have a "stereotyped" prefix (such as "ATG" for A. thaliana), that prefix is given here and omitted from the gene boxes for illustration clarity.
Color-code key
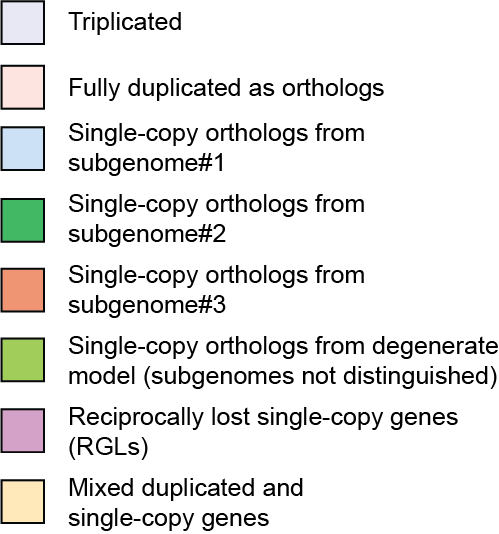 Displays a key showing the meaning of the different gene colors from the gene panel. For instance, light blue is a single-copy gene present in all of the genomes and deriving from subgenome #1, which is commonly the least-fractionated (but see the specific model for the event in question). For the yeast WGD, no biased fractionation is modeled, meaning that it is not possible to distinguish a more and a less fractionated subgenome. Hence, single-copy orthologs are depicted as olive green for both tracks in this case. Any cases of reciprocal gene loss in a WGD are shown in purple/pink.
POInTbrowse Statistics
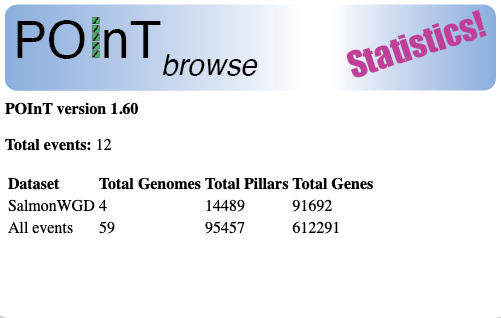 Displays the version of POInT currently running and the number of polyploidy events currently in the browser. It also gives the number of genomes, pillars and genes in both the current event and across all events.
Fully-retained duplicate genes
Pillars colored pink are pillars where all genomes retain the duplicated genes produced by the WGD. For the case of a genome triplication/hexaploidy, pillars are colored pink if all genomes retain orthologous duplicated genes (e.g., the gene lost was from the same subgenome in all extant genomes).
Single-copy genes from a common subgenome
Pillars colored blue or green (or orange for a genome triplication) are pillars where all genomes have single-copy genes and where all of the copies are orthologs. For polyploidy events with biased fractionation, blue pillars denote the less fractionated subgenome and green ones the more fractionated one.
Pillars with mixtures of duplicates and single-copy genes
Many or most pillars for a given event will have some genomes preserving the duplicate copies and some genomes having returned to single copy. These pillars are shown in tan.
Download gene trees for a pillar
Clicking on the tree pictogram at the bottom of a pillar will produce an inferred gene tree for the pillar in question. This tree assumes the set of species relationships shown with the POInT Tree pictogram and assigns the genes in question as two groups of orthologs following those relationships, with any lost genes pruned from the gene tree. Hence, for a fully-duplicated pillar, two mirrored species trees would be included, one with the genes in the upper panel of the pillar and one with those from the lower panel. The tree will be provided either in NEXUS or Newick (Phylip) format, depending on the option selected above.
Download codings sequences for a pillar
Clicking on the "CDS" tag at the bottom of a pillar will download a FASTA file with the coding regions of the genes in that pillar (e.g., the direct translation of these DNA sequences will produce the peptides produced by these genes).
Jumps to another region
The red region shows the location of the illustrated frame relative to the full dataset. You can jump to other regions of the dataset by clicking at the various points along this line.
Opens the help page
Link on the main browser page to this help document
Link to send an email to G. Conant, POInT's author/maintainer.
Publications useful for citing POInT and the POInT datasets
This window should help deciding if a citation of POInT is appropriate and which one to use.
Download full POInT datasets
If you wish to download input files to run your own POInT analyses, the full dataset set needed for replicating our POInT analyses of each polyploidy event are provided here. These files include an "Order data" tar file with two components:
- Gene order files for each included genome
- A global pillar order file, giving the genes present in each pillar and the relative order of those pillars
In addition, a tree file with POInT's parameter estimates and a tar file with coding sequences for all pillars are provided.
Download current browser frame in PDF format
This button allows you to download an editable copy of the current browser frame for presentation or publication purposes (PDF format).
Searching for genes not in the synteny set
POInT requires that a homolog of each ancestral gene be found in all decendant polyploid genomes. As a result, genes that are missing from one or more of the polyploid genomes will not appear in the POInT datasets. If one of these genes is searched for, the browser will try to place that gene in a synteny block with POInT pillars. If this is possible, it will be shown relative to its two nearest neighbors in the genome with a red arrow. Otherwise, the browser will return an error.
Depicting embedded synteny blocks
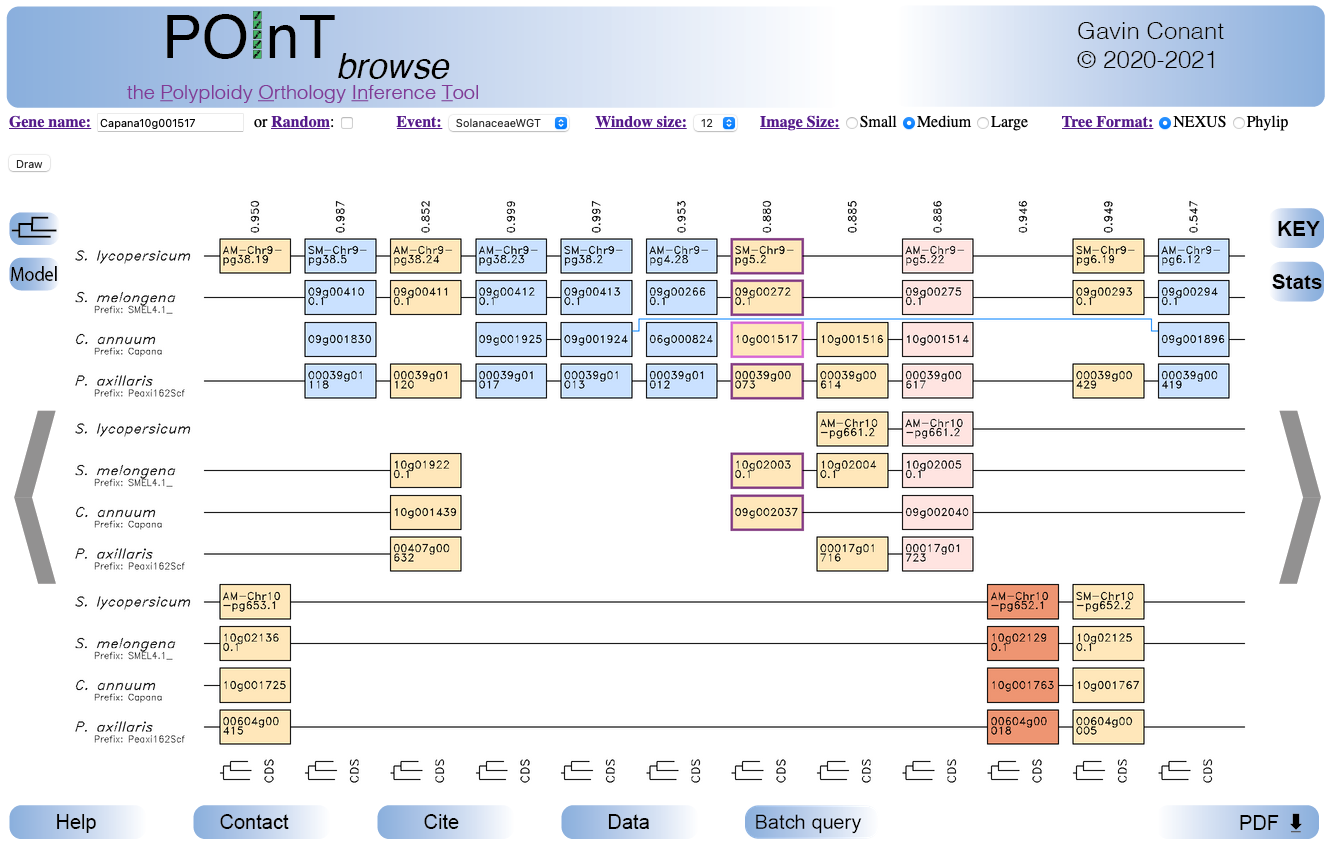
Occasionally, POInT will infer that a synteny block is actually embedded in another larger one. This effect is mostly likely due to a post-polyploidy translocation, such that the loss data suggest the a short region of genes was ancestrally in synteny with the larger region. This effect is illustrated with a blue "bracket" showing the larger synteny block in which the other region fits.
Further reading
The published paper describing the browser itself is
- Siddiqui, M. and G. C. Conant. (2023) POInTbrowse: Orthology prediction and synteny exploration for paleopolyploid genomes. BMC Bioinformatics, 24: 174. [Reprint]
There are two book chapters, covering the POInT pipeline (1) and the POInT algorithm itself (2), which are good starting places for these tools:
- (1) Hao, Y. and G. C. Conant. 2022. POInT: A tool for modeling ancient polyploidies using multiple polyploid genomes. Plant Comparative Genomics, pp 81-91. [Reprint]
- (2) G. C. Conant. 2023. POInT: Modeling Polyploidy in the Era of Ubiquitous Genomics. Polyploidy: Methods and Protocols , pp 77-91. [Reprint]
The two published papers best describing the POInT computation are:
- Emery, M., M. M. S. Willis, Y. Hao, K. Barry, K. Oakgrove, Y. Peng, J. Schmutz, E. Lyons, J. C. Pires, P. P. Edger, and G. C. Conant. 2018. Preferential retention of genes from one parental genome after polyploidy illustrates the nature and scope of the genomic conflicts induced by hybridization. PLoS Genetics 14: e1007267.
- Conant, G. C. and K. H. Wolfe. (2008) Probabilistic cross-species inference of orthologous genomic regions created by whole-genome duplication in yeast, Genetics 179: 1681-1692.
The POInT source code, including the browser, is available from GitHub.
Other papers using POInT data, available from the lab website:
- McRae, L., A. Beric and G. C. Conant. (2022) Hybridization order is not the driving factor behind biases in duplicate gene losses among the hexaploid Solanaceae. Proceedings of the Royal Society, Biological Sciences, 289: 20221810.
- Hao, Y., J. Fleming, J. Petterson, E. Lyons, P. P. Edger, J. C. Pires, J. L. Thorne, and G. C. Conant. (2022) Convergent evolution of polyploid genomes from across the eukaryotic tree of life. G3: Genes, Genomes, Genetics,
- Hao Y, M. E. Mabry, P. Edger, M. Freeling, C. Zheng, L. Jin, R. VanBuren, M. Colle, H. An, R. S. Abrahams, J. D. Washburn, X. Qi, K. Barry, C. Daum, S. Shu, J. Schmutz, D. Sankoff, M. S. Barker, E. Lyons, J. C. Pires and G. C. Conant (2021) The contributions of the allopolyploid parents of the mesopolyploid Brassiceae are evolutionarily distinct but functionally compatible. Genome Research 31: 799-810
- Conant, G. C. (2020) The lasting after-effects of an ancient polyploidy on the genomes of teleosts. PLoS ONE, 15: e0231356.
- Schoonmaker, A., Y. Hao, D. M. McK Bird and G C. Conant. (2020) A single, shared triploidy in three species of parasitic nematodes. G3: Genes, Genomes, Genetics, 10: 225-233.
- Scienski, K., J. C. Fay, and G. C. Conant. (2015) Patterns of gene conversion in duplicated yeast histones suggests strong selection on a co-adapted macromolecular complex, Genome Biology and Evolution, 7: 3249-3258.
- G. C. Conant. (2014) Comparative genomics as a time machine: How relative gene dosage and metabolic requirements shaped the time-dependent resolution of yeast polyploidy, Molecular Biology and Evolution, 31: 3184-3193.
- Casola, C., G. C. Conant and M. W. Hahn, (2012) Very low rate of gene conversion in the yeast genome, Molecular Biology and Evolution, 29: 3817-3826.
- Evangelisti, A. M. and G. C. Conant, (2010) Non-random survival of gene conversions among yeast ribosomal proteins duplicated through genome doubling,
Genome Biology and Evolution 2: 826-834.
Updates
31 Jan. 2021:
Added the ability to search for genes present in our homology searches but not places in the final POInT dataset. This feature may increase the number of searchable genes by as much as a factor of 4, but will still not include all genes in a given genome, because some of these genes lack homologs in other genomes or are not part of POInT synteny blocks.
15 Feb. 2021:
Added a button allowing users to download the current browser frame as a vector graphic. Currently only Postscript-formatted output is available, but further releases are planned to include a PDF download option.
15 March 2021:
Added the ability to search by common name for bakers yeast, A. thaliana and zebrafish.
17 May 2021:
The download format is now PDF rather than Postscript. The browser images have also been somewhat improved.
30 Sept. 2021:
Added a batch download feature ("Batch Query" button) allowing users to request CDS files and gene trees for all pillars from a particular event matching set criteria
16 Feb. 2022:
Added a "Model" button that produces a visual representation of the duplicate loss model used for each event.
28 Feb. 2022:
Added the option of visualizing random pillars and extended the help/documentation system.
9 March 2022:
Corrected the computation of orthology confidence values for genome triplications with missing tracks and changed the representation of the confidence values and coloring for degenerate WGD events such as yeast.
6 April 2022:
Fixed an illustration issue with respect to drawing regions where one synteny block is embedded in another.
9 November 2022:
Added a "Stats" button to the browser that gives the size (in terms of genomes and genes) of both the current event and all events in the browser.
2 December 2022:
Added RGL coloring, a "sliding" bar at the bottom of the browser window and improved the error reporting in the browser.
19 January 2023:
Added POInT version number reporting to the "Stats" window.
15 March 2023:
POInTbrowse version 1.61. The default page now requires the selection of an event prior to search. Gene names, aliases and chromosomal coordinates are now provides on hover in the browser window. Links to selected model organism gene pages are also provided.
12 May 2023:
Added the capacity to serve out multiple versions of a given polyploidy.
20 August 2025:
Updated the download app to allow for different polyploidy versions.